WEB-BASED PORTAL FOR VIEWING DATA
luxData.web is a web portal for luxData that provides internal and external users with simple access to released
data and GIS information. It also allows master and maintenance data to be processed in a user-friendly way. System
malfunctions may also be directly recorded with luxData.web when required.
|
luxData.web_product description
|
We will be happy to advise you!
Do you have questions about luxData.web, would you like to get more information about this software, or do you need comprehensive advice?
Please feel free to contact us by email or call us directly: 08051 / 96 557- 04
After you have successfully logged into luxData.web, you reach the dashboard. Within the dashboard you will find various information, overviews and graphic representations or evaluations. The dashboard can be configured within luxData. This means you can decide what information you want to see at first glance. Among other things, the dashboard provides a quick overview of the system inventory and open faults for you and your customers. As soon as you log in, you can see whether, for example, the troubleshooting time has improved over the last few weeks or not. If you change data, e.g. within the faults, this will be transferred to the overview or evaluation in the dashboard and you will find the updated data the next time you log in.
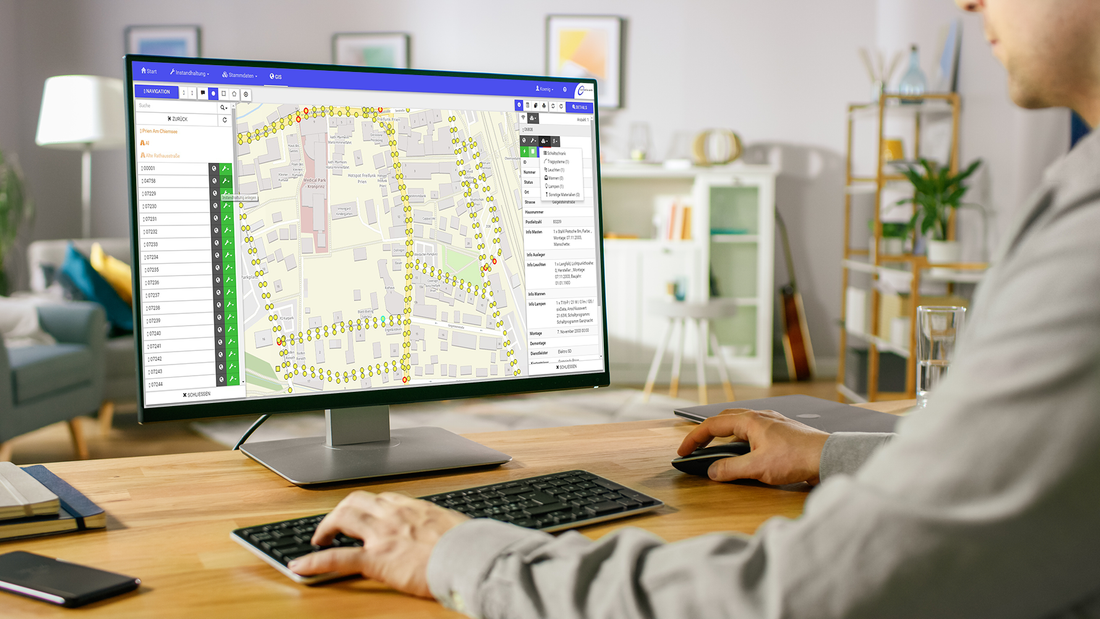
It would also enable users to show the lighting points for any districts or roads and so on in a table list using the tree view. The list may be sorted and filtered as desired. The layout-true reports already described for the desktop version of luxData may also be used to output the filtered lists of data records (PDF, HTML, Excel, Word, etc.).
Direct export to Excel, CSV and Access (for larger amounts of data) is also possible as is displaying the current data quantities in a pop-up window on the map.
The defects saved in luxData.licht may be sorted, filtered and exported to a list here. This would allow municipal customers to be provided with an overview of the defects currently being experienced in the areas for which they are responsible. It would also allow the details and the measures implemented to eliminate the defects (processes and components) to be displayed when the defect in the system is double-clicked.
luxData.web provides an integrated geo-information system that is able to display the lighting points on any map material. It is possible to incorporate any additional source of GIS data (OGC WMS, WFS, Oracle, PostGIS, Shapefiles etc.) alongside the already pre-configured basic and free OpenStreetMap, which would, for example, show additional layers for cable gears, ALK, aerial images and so on. The map view also allows users to click lighting points so that defects may, for example, be reported or the area around the lighting point viewed with the help of Google StreetView (as it becomes available in Germany): the GIS viewer in luxData.web doesn't require any browser plug-ins (e.g. ActiveX or Java and so on) and will work with all modern browsers.
luxData.web uses the same user-management system as luxData.licht. Only the check mark must be set in luxData.licht's user management to allow individual users or entire groups to log into luxData.web. We also provide an add-in for luxData that makes it possible to assign detailed rights for luxData.web and which also allows rights to be assigned, for example, for the GIS layer or to permit defect reports to be made.
Operators who are handling data for several municipal customers within a luxData database are also able to define users and user groups for individual locations. Filtering by cost carriers and owners is also possible. This means that municipal or commercial customers would only be able to see the data for which they have received authorisation.
luxData.web wird häufig als Auskunftslösung für externe Auftraggeber bzw. interne Stellen genutzt. Hierbei sollte ersichtlich sein, dass luxData.web eine Anwendung von Ihrem Unternehmen ist. Aus diesem Grund machen wir es möglich, luxData.web Ihrem CI und Ihren Anforderungen anzupassen. Diese Anpassungen können global (für alle Benutzer) oder auf Benutzer (Gruppen) -Level in luxData.licht gespeichert werden. In luxData.web kann folgendes angepasst werden:
• Logo
• Impressum
• Schriftart
• Jegliche Farben
• Das komplette Dashboard
• Die Spalten der Grids (welche Spalten, Reihenfolge der Spalten)
• Alle Formulare (welche Gruppierungen, welche Reihenfolge der Gruppierungen, welche Felder, welche Reihenfolge der Felder)
• Das GIS: Die Symbolik für die Objekte, inklusiv der Farben, der Größe und der Labels; das Kartenmaterial, die Auswahl der
Such-Optionen und welche Informationen im Detail-Panel angezeigt werden
• Kundenspezifische (Zusatz-)Logik (per Script-Code, wie aus luxData.licht gewohnt)